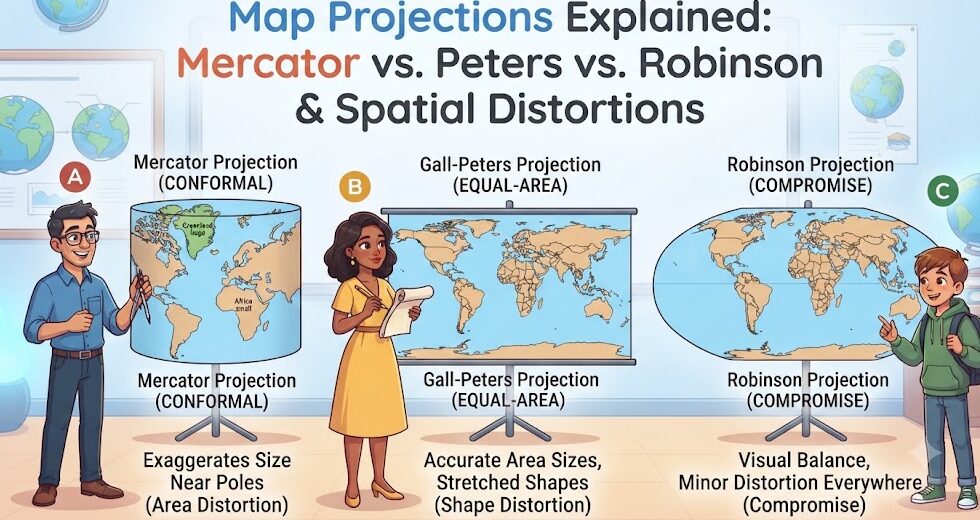
Every two-dimensional map of the Earth represents a fundamental mathematical compromise. Because the Earth is a three-dimensional oblate spheroid—slightly flattened at the poles and bulging at the equator—it is physically impossible to flatten its surface onto a plane sheet of paper or computer screen without introducing distortion. Cartographers refer to this mathematical reality through Carl Friedrich Gauss’s celebrated Theorema Egregium, which proves that a sphere’s surface cannot be projected onto a flat plane without stretching, tearing, or compressing its surface features. Consequently, every map projection in existence must systematically sacrifice one or more core spatial attributes: area, shape, distance, or direction.
The Fundamental Dilemma: Conformal vs. Equal-Area
In cartographic mathematics, projections are broadly divided according to which geometric property they preserve:
Conformal (Orthomorphic) Projections: Preserve local shapes and angles perfectly. At any given coordinate on the map, scale is identical in all directions. Parallels and meridians intersect at 90-degree angles. While vital for maritime navigation and aerospace flight paths where bearing and compass heading are paramount, conformal projections severely distort land area, progressively exaggerating the size of territories situated near the poles.
Equal-Area (Equivalent) Projections: Maintain exact proportional surface area across the entire globe. A square centimeter anywhere on the map represents the exact same number of square kilometers on the ground. However, to maintain true area, landmasses and oceans must undergo significant shear and angular distortion, causing continents to appear severely stretched or compressed.
Compromise Projections: Consciously balance distortion across both area and shape without being strictly conformal or equal-area. These projections are engineered specifically for visual harmony in thematic world atlases and educational textbooks.
| Projection Name | Origin Year & Inventor | Classification | Preserved Property | Primary Distortion / Flaw |
|---|---|---|---|---|
| Mercator | 1569 (Gerardus Mercator) | Cylindrical Conformal | True Direction (Rhumb lines) | Extreme high-latitude area exaggeration (Greenland appears equal to Africa). |
| Gall-Peters | 1855 / 1973 (James Gall / Arno Peters) | Cylindrical Equal-Area | True Surface Area | Severe north-south elongation at equator; east-west stretching at poles. |
| Robinson | 1963 (Arthur H. Robinson) | Pseudocylindrical Compromise | Visual Balance (Aesthetic) | Neither equal-area nor conformal; severe polar stretching. |
| Winkel Tripel | 1921 (Oswald Winkel) | Modified Azimuthal Compromise | Minimal Area, Direction & Distance distortion | National Geographic standard since 1998; slight curved polar distortion. |
| Goode Homolosine | 1923 (John Paul Goode) | Interrupted Pseudocylindrical | True Area with minimal shape distortion | Interrupted ocean lobes make oceanic spatial analysis difficult. |
The Mercator Projection: Maritime Genius and Cultural Controversy
Conceived in 1569 by Flemish cartographer Gerardus Mercator, the Mercator projection was engineered with a singular, revolutionary operational objective: safe maritime navigation. Mercator arranged the graticule such that any straight line drawn on the map represents a line of constant compass bearing, mathematically termed a rhumb line or loxodrome. A sea captain in the sixteenth century could lay a ruler between Lisbon and the West Indies, read the straight compass angle, set the ship’s rudder, and sail confidently across the open ocean without recalculating complex spherical trigonometric arcs.
The Greenland Problem: Extreme High-Latitude Inflation
To preserve constant compass bearings, the distance between lines of latitude on a Mercator map must increase exponentially as one approaches the poles. At the equator, there is zero distortion. But at 60 degrees latitude, features are stretched by a factor of two in both dimensions (quadrupling total visual area). At 80 degrees latitude, land area is visually inflated by a factor of 33.
This mathematical inflation creates the famous “Greenland Problem”: on a Mercator world map, Greenland appears comparable in size to the entire continent of Africa. In reality, Africa encompasses 30.37 million square kilometers—making it more than fourteen times larger than Greenland (2.16 million km²). Similarly, Europe appears larger than South America, when South America is nearly double Europe’s physical land area.
The Gall-Peters Projection: The Quest for Social Justice in Cartography
In 1973, German historian Arno Peters presented a world map projection based on the earlier 1855 work of Scottish clergyman James Gall. Peters championed the Gall-Peters projection as an ideological antidote to Mercator, arguing that standard colonial-era maps diminished developing global south nations by visually compressing the tropical belt. Peters promoted his equal-area cylindrical projection as the only “ethically just” representation of the globe.
While the Gall-Peters projection correctly displays the true proportional land area of all countries, it achieves this at the expense of severe angular and shape distortion. Equatorial continents like Africa and South America appear drastically elongated and “stretched like wet laundry,” while temperate nations appear flattened horizontally. Professional cartographers heavily criticized Peters for claiming his projection was the first or only equal-area solution, pointing out that dozens of superior equal-area projections (such as Mollweide, Lambert, and Albers) had already existed for centuries without creating such severe shape distortion.
Modern Compromise Projections: Robinson and Winkel Tripel
Recognizing the limitations of both extreme conformality (Mercator) and extreme equal-area distortion (Gall-Peters), modern institutional cartographers turned to compromise projections for general thematic display.
The Robinson Projection (1963)
Commissioned by the commercial atlas publisher Rand McNally, American cartographer Arthur H. Robinson adopted an empirical, visual design approach rather than a strict mathematical formula. Robinson calculated coordinate tables to create a world map that “looks right” to human perception. Parallels are straight horizontal lines, while meridians curve gently toward straight polar lines. The National Geographic Society adopted the Robinson projection as its standard world map from 1988 until 1998, popularizing its visually pleasing, balanced aesthetic worldwide.
The Winkel Tripel Projection (1921)
In 1998, the National Geographic Society replaced Robinson with the Winkel Tripel (Winkel III) projection, invented in 1921 by German cartographer Oswald Winkel. The word Tripel (“triple”) refers to Winkel’s objective of minimizing three primary forms of distortion simultaneously: area, direction, and distance. Mathematically calculated as the arithmetic mean of the equirectangular projection and the Aitoff projection, Winkel Tripel provides exceptionally low overall distortion across continental landmasses and has become the gold standard for modern geographic education.
The Digital Age: Web Mercator and Dynamic Tiling
With the dawn of satellite navigation and internet cartography in the early 2000s, one might have expected Mercator to fade into obscurity. Instead, the rise of Google Maps, OpenStreetMap, Apple Maps, and Bing Maps caused an unexpected resurgence of the projection in the form of Web Mercator (EPSG:3857).
Web Mercator was chosen by tech giants for specific computational advantages: because it is conformal, local street corners, building footprints, and road intersections always cross at true 90-degree right angles regardless of zoom level. Furthermore, a square map tile at any latitude can be seamlessly subdivided into four identical square tiles at the next zoom level, drastically optimizing server caching and rendering speeds across mobile devices. However, because Web Mercator cannot project the mathematical poles, digital maps typically truncate latitude at approximately 85.0511 degrees north and south.
Frequently Asked Questions About Map Projections
Can any flat map be 100% accurate?
No. Gauss’s mathematical theorem proves that no spherical surface can be mapped onto a flat plane without introducing distortion in shape, area, distance, or direction. The only truly accurate, non-distorted physical representation of Earth is a three-dimensional spherical globe.
Which projection is best for global demographic comparisons?
For statistical, demographic, and environmental comparisons (such as showing global population density, agricultural land, or forest cover), an equal-area projection such as the Eckert IV, Mollweide, or Goode Homolosine is strongly recommended, as these projections prevent visual misrepresentation of geographical quantities.
Why does Antarctica appear so enormous on many maps?
On cylindrical projections like Mercator and Web Mercator, the South Pole (a single mathematical point) is stretched across the entire width of the bottom border of the map, making Antarctica appear as an infinite, colossal wall of ice rather than an isolated continent of 14.2 million square kilometers.